macocci7/php-lorenz-curve
Composer 安装命令:
composer require macocci7/php-lorenz-curve
包简介
A PHP Library to plot a Lorenz Curve.
README 文档
README
A PHP Library to draw a Lorenz Curve.
1. Features
PHP-LorenzCurve draws a Lorenz Curve and also calculates the Gini's coefficient.

Of course, you can also obtain only parsed data such as coordinates for each point and the Gini's coefficient without generating an image.
2. Contents
- 1. Features
- 2. Contents
- 3. Requirements
- 4. Installation
- 5. Usage
- 6. Examples
- 7. LICENSE
3. Requirements
-
PHP 8.3 or later
-
Imagick PHP Extension
Check with commands:
(php -m; php -i) | grep imagick
-
Mbstring PHP Extension
Check with commands:
(php -m; php -i) | grep mbstring
4. Installation
composer require macocci7-lorenz-curve
5. Usage
5.1. Basic Usage
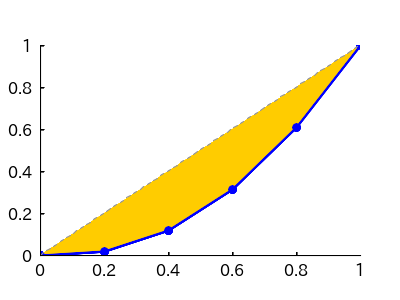
To draw a Lorenz Curve, create an instance of LorenzCurve class at first.
<?php

require_once __DIR__ . '/../vendor/autoload.php';

use Macocci7\PhpLorenzCurve\LorenzCurve;

$lc = new LorenzCurve();
Next, set the data, the class range and save the image into a file.
$lc
    ->setData([1, 5, 10, 15, 20])
    ->setClassRange(5)
    ->create('img/BasicUsage.png');
This results in the image below.
5.2. Adjusting the Appearance
5.2.1. Drawing Grid Lines
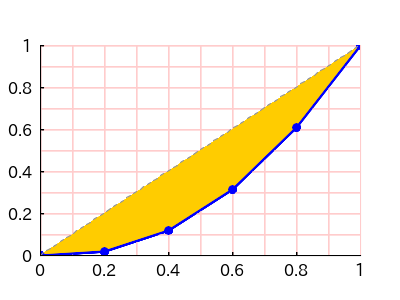
You can draw grid lines with grid() method specifying the width and the color.
Note: Specifying
nullas a color code results in transparent.
$lc
    ->setData([1, 5, 10, 15, 20])
    ->setClassRange(5)
    ->grid(1, '#ffcccc')    // width: 1 pix, color: '#ffcccc'
    ->create('img/DrawGrid.png');
This results in the image below.

5.2.2. Drawing an Upward Convex Curve
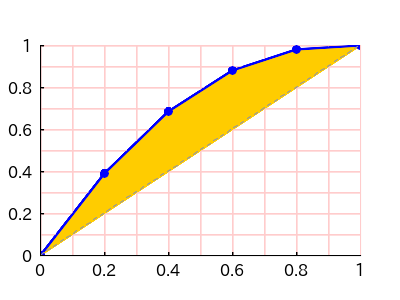
You can create an upward convex Lorenz Curve by sorting the list of the classes in decending order with reverseClasses() method.
$lc
    ->setData([1, 5, 10, 15, 20])
    ->setClassRange(5)
    ->reverseClasses()
    ->grid(1, '#ffcccc')
    ->create('img/UpwardConvexCurve.png');
This results in the image below.

5.2.3. Setting the Image Size
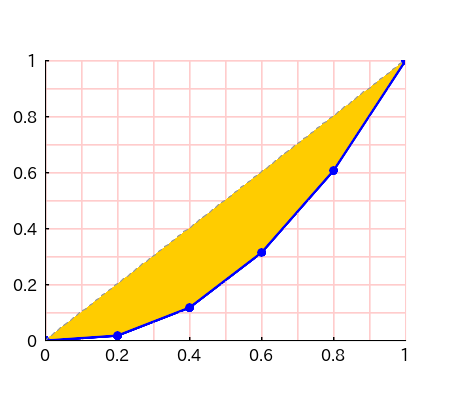
PHP-LorenzCurve generates images with a width of 400 pixels and a height of 300 pixels by default.
You can change the image size with resize() method.
- format:
resize(int $width, int $height)
$lc
    ->setData([1, 5, 10, 15, 20])
    ->setClassRange(5)
    ->grid(1, '#ffcccc')
    ->resize(450, 400)
    ->create('img/ResizeImage.png');
This code results in as below:

5.2.4. Setting the Attributes of Plotarea
By default, PHP-LorenzCurve sets the Attributes of Plotarea:
offsetX: 10% of the image widthoffsetY: 10% of the image heightwidth: 80% of the image widthheight: 70% of the image heightbackgroundColor:null(transparent)
You can change them with plotarea() method.
- format:
plotarea(
    array $offset = [], // [int $width, int $height]
    int $width = 0,
    int $height = 0,
    string|null $backgroundColor = null,
)
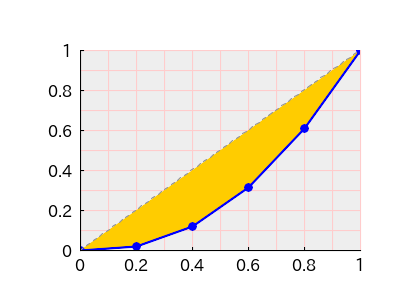
Sample code:
$lc
    ->setData([1, 5, 10, 15, 20])
    ->setClassRange(5)
    ->grid(1, '#ffcccc')
    ->plotarea(
        offset: [80, 50],
        width: 280,
        height: 200,
        backgroundColor: '#eeeeee',
    )
    ->create('img/SetPlotareaAttrs.png');
This code results in as below:

5.2.5. Setting Caption and Labels
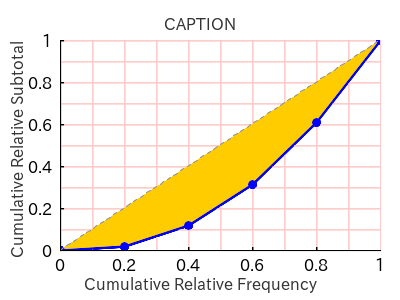
You can set the Caption and Labels with caption(), labelX() and labelY() methods.
-
Format:
caption(
    string $caption,
    int $offsetX = 0,
    int $offsetY = 0,
)
labelX(
    string $label,
    int $offsetX = 0,
    int $offsetY = 0,
)
labelY(
    string $label,
    int $offsetX = 0,
    int $offsetY = 0,
)
Sample code:
$lc
    ->setData([1, 5, 10, 15, 20])
    ->setClassRange(5)
    ->grid(1, '#ffcccc')
    ->plotarea(offset: [60, 40])
    ->caption('CAPTION')
    ->labelX('Cumulative Relative Frequency', offsetX: 0, offsetY: 10)
    ->labelY('Cumulative Relative Subtotal')
    ->create('img/CaptionLabels.png');
This code results in as below:

5.2.6. Setting Attributes with Array
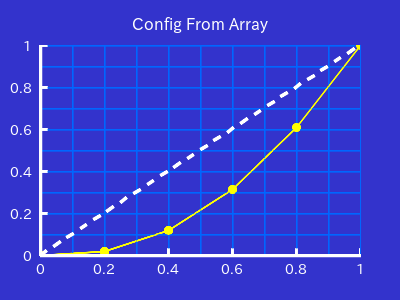
You can set attributes with the config() method passing array as an argument.
$lc
    ->setData([1, 5, 10, 15, 20])
    ->setClassRange(5)
    ->config([
        'canvasBackgroundColor' => '#3333cc',
        'showGrid' => true,
        'gridWidth' => 1,
        'gridColor' => '#0066ff',
        'axisWidth' => 3,
        'axisColor' => '#ffffff',
        'scaleWidth' => 2,
        'scaleLength' => 6,
        'scaleColor' => '#ffffff',
        'scaleFontSize' => 14,
        'scaleFontColor' => '#ffffff',
        'lorenzCurveWidth' => 1,
        'lorenzCurveColor' => '#ffff00',
        'lorenzCurveBackgroundColor' => null, // transparent
        'completeEqualityLineWidth' => 3,
        'completeEqualityLineColor' => '#ffffff',
        'completeEqualityLineDash' => [8, 8],
        'fontColor' => '#ffffff',
        'caption' => 'Config From Array',
    ])
    ->create('img/ConfigFromArray.png');
This code results in as below:

See more: Customizable Attributes
5.2.7. Setting Attributes with Neon File
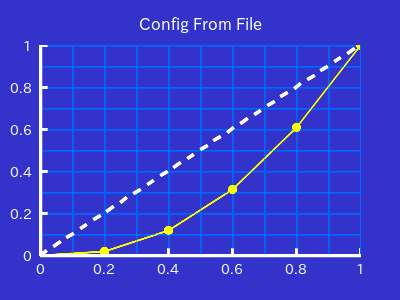
You can set attributes with config() method passing the neon file path as an argument.
First, create a Neon File.
canvasBackgroundColor: '#3333cc'
showGrid: true
gridWidth: 1
gridColor: '#0066ff'
axisWidth: 3
axisColor: '#ffffff'
scaleWidth: 2
scaleLength: 6
scaleColor: '#ffffff'
scaleFontSize: 14
scaleFontColor: '#ffffff'
lorenzCurveWidth: 1
lorenzCurveColor: '#ffff00'
lorenzCurveBackgroundColor:
completeEqualityLineWidth: 3
completeEqualityLineColor: '#ffffff'
completeEqualityLineDash: [8, 8]
fontColor: '#ffffff'
caption: 'Config From File'
Second, specify the path of the neon file as an argument of the config() method.
$lc
    ->setData([1, 5, 10, 15, 20])
    ->setClassRange(5)
    ->config('ConfigFromFile.neon')
    ->create('img/ConfigFromFile.png');
This code results in as below:

See more: Customizable Attributes
5.2.8. Customisable Attributes
| attribute | type | default | example | description |
|---|---|---|---|---|
| canvasSize['width'] | int | 400 | 450 | image width |
| canvasSize['height'] | int | 300 | 400 | image height |
| canvasBackgroundColor | string | '#ffffff' | '#0000ff' | background color of the image |
| plotarea['offset'] | int[] | 10% of the image size | [40, 50] | offset of the plotarea |
| plotarea['width'] | int | 80% of the image size | 500 | plotarea width |
| plotarea['height'] | int | 70% of the image size | 400 | plotarea height |
| plotarea['backgroundColor'] | string | null |
'#cccccc' | background color of the plotarea |
| showGrid | bool | false |
true |
whether to show grid lines |
| gridWidth | int | 1 | 2 | grid line width |
| gridColor | string | '#cccccc' | '#0099ff' | grid line color |
| axisWidth | int | 2 | 3 | axis width |
| axisColor | string | '#000000' | '#ffffff' | axis color |
| scaleWidth | int | 1 | 2 | scale width |
| scaleLength | int | 3 | 6 | scale length |
| scaleColor | string | '#000000' | '#ffffff' | scale color |
| scaleFontSize | int | 16 | 14 | scale font size |
| scaleFontPath | string | 'fonts/ipaexg.ttf' | 'fonts/myfont.ttf' | scale font path |
| scaleFontColor | string | '#000000' | '#ffffff' | scale font color |
| lorenzCurveWidth | int | 2 | 1 | Lorenz Curve width |
| lorenzCurveColor | string | '#0000ff' | '#ffff00' | Lorenz Curve Color |
| lorenzCurveBackgroundColor | string | '#ffcc00' | null |
Lorenz Curve background color |
| completeEqualityLineWidth | int | 1 | 2 | complete equality line width |
| completeEqualityLineColor | string | '#999999' | '#ffffff' | complete equality line color |
| completeEqualityLineDash | int[] | [4, 4] | [8, 8] | complete equality line dash pattern (solid and blank) |
| fontPath | string | 'fonts/ipaexg.ttf' | 'fonts/myfont.ttf' | font path |
| fontSize | int | 16 | 14 | font size |
| fontColor | string | '#333333' | '#ffffff' | font color |
| labelX | string | '' | 'Cumulative Relative Frequency' | x label |
| labelXOffsetX | int | 0 | -10 | x-offset of x label |
| labelXOffsetY | int | 0 | 10 | y-offset of x label |
| labelY | string | '' | 'Cumulative Relative Subtotal' | y label |
| labelYOffsetX | int | 0 | -10 | x-offset of y label |
| labelYOffsetY | int | 0 | -10 | y-offset of y label |
| caption | string | '' | 'CAPTION' | caption |
| captionOffsetX | int | 0 | 10 | x-offset of caption |
| captionOffsetY | int | 0 | -10 | y-offset of caption |
5.3. Gini's Coefficient
You can get the Gini's Coefficient with getGinisCoefficient() method without generating an image.
var_dump(
    $lc
    ->setData([1, 5, 10, 15, 20])
    ->setClassRange(5)
    ->getGinisCoefficient()
);
This results in as below.
float(0.3764705882352942)
5.4. Getting Parsed Data
You can get only parsed data with parse() method without generating an image.
var_dump(
    $lc
    ->setData([1, 5, 10, 15, 20])
    ->setClassRange(5)
    ->parse()
);
This results in as below.
array(3) {
  'data' =>
  array(5) {
    [0] =>
    int(1)
    [1] =>
    int(5)
    [2] =>
    int(10)
    [3] =>
    int(15)
    [4] =>
    int(20)
  }
  'points' =>
  array(6) {
    [0] =>
    array(2) {
      [0] =>
      int(0)
      [1] =>
      int(0)
    }
    [1] =>
    array(2) {
      [0] =>
      double(0.2)
      [1] =>
      double(0.0196078431372549)
    }
    [2] =>
    array(2) {
      [0] =>
      double(0.4)
      [1] =>
      double(0.11764705882352941)
    }
    [3] =>
    array(2) {
      [0] =>
      double(0.6000000000000001)
      [1] =>
      double(0.3137254901960784)
    }
    [4] =>
    array(2) {
      [0] =>
      double(0.8)
      [1] =>
      double(0.607843137254902)
    }
    [5] =>
    array(2) {
      [0] =>
      double(1)
      [1] =>
      double(1)
    }
  }
  'ginis_coefficient' =>
  double(0.3764705882352942)
}
6. Examples
-
BasicUsage.php >> results in:
-
DrawGrid.php >> results in:
-
UpwardConvexCurve.php >> results in:
-
ResizeImage.php >> results in:
-
SetPlotareaAttrs.php >> results in:
-
CaptionLabels.php >> results in:
-
ConfigFromArray.php >> results in:
-
ConfigFromFile.php with ConfigFromFile.neon >> results in:
-
GinisCoefficient.php >> results in:
float(0.3764705882352942)
-
GinisCoefficient0.php >> results in:
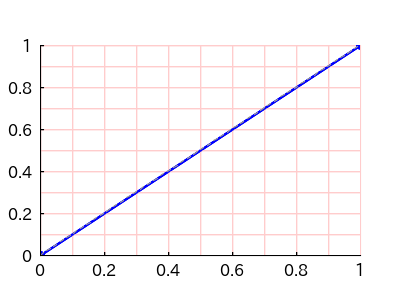
▼Gini's Coefficient:
float(0)
-
GinisCoefficientAlmost1.php >> results in:
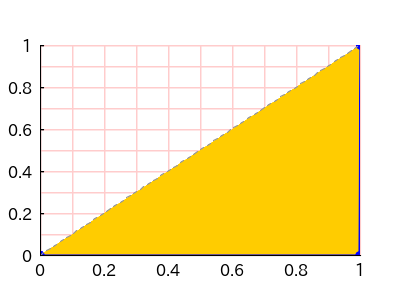
▼Gini's Coefficient:
float(0.998003992015968)
-
GinisCoefficient1.php >> results in:
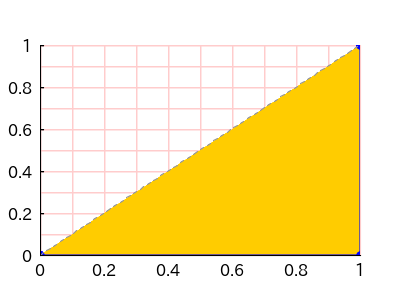
▼Gini's Coefficient:
float(1)
-
Parse.php >> results in:
array(3) {
'data' =>
array(5) {
    [0] =>
    int(1)
    [1] =>
    int(5)
    [2] =>
    int(10)
    [3] =>
    int(15)
    [4] =>
    int(20)
}
'points' =>
array(6) {
    [0] =>
    array(2) {
    [0] =>
    int(0)
    [1] =>
    int(0)
    }
    [1] =>
    array(2) {
    [0] =>
    double(0.2)
    [1] =>
    double(0.0196078431372549)
    }
    [2] =>
    array(2) {
    [0] =>
    double(0.4)
    [1] =>
    double(0.11764705882352941)
    }
    [3] =>
    array(2) {
    [0] =>
    double(0.6000000000000001)
    [1] =>
    double(0.3137254901960784)
    }
    [4] =>
    array(2) {
    [0] =>
    double(0.8)
    [1] =>
    double(0.607843137254902)
    }
    [5] =>
    array(2) {
    [0] =>
    double(1)
    [1] =>
    double(1)
    }
}
'ginis_coefficient' =>
double(0.3764705882352942)
}


7. LICENSE
macocci7/php-lorenz-curve 适用场景与选型建议
macocci7/php-lorenz-curve 是一款 基于 PHP 开发的 Composer 扩展包,目前已累计 10 次下载、GitHub Stars 达 2, 最近一次更新时间为 2024 年 08 月 01 日, 在 PHP 生态内属于活跃度较高的组件。
我们在过去多个企业项目中使用过 macocci7/php-lorenz-curve 或与其功能相近的方案,如果你在选型或落地过程中遇到问题,例如 版本兼容、二次改造、私有化封装、与内部系统对接、生产 BUG 排查,欢迎联系我们协助评估。
基于 macocci7/php-lorenz-curve 在你已有业务上做功能扩展、字段裁剪、UI 适配、与内部账号 / 权限 / 日志系统的深度对接。
线上偶发问题、内存泄漏、慢查询、并发异常等排查修复;针对高流量场景做缓存、队列、索引层面的调优。
承接完整的项目从需求 → 设计 → 开发 → 上线 → 长期运维;也可按月提供技术保姆服务。
统计信息
- 总下载量: 10
- 月度下载量: 0
- 日度下载量: 0
- 收藏数: 2
- 点击次数: 22
- 依赖项目数: 0
- 推荐数: 0
其他信息
- 授权协议: MIT
- 更新时间: 2024-08-01