martinsik/google-chart-generator
Composer 安装命令:
composer require martinsik/google-chart-generator
包简介
PHP 5.4+ wrapper around Google Chart API using Polymer 1.0 <google-chart> element
README 文档
README
PHP 5.4+ wrapper around Google Chart API based on Polymer 1.0 component <google-chart>.
Installation
Add composer.json dependency:
"require": {
    "martinsik/google-chart-generator": "^2.0.0"
}
Add bower.json dependency (Polymer 1.0):
"dependencies": {
    "google-chart": "GoogleWebComponents/google-chart#^1.0.0"
}
Eventually, install google-chart Polymer component as you want.
Charts
Right now, four chart types are supported: line, bar, column and pie charts.
The PHP wrapper is very liberal, it lets you set any Google Chart options via data or chart options. It doesn't have special methods for every possible option because there are are so many of them and it doesn't make sense to make wrappers for every single one of them.
To use any chart you have to import Polymer 1.0 element and WebComponents polyfill first:
<!-- Polyfill Web Components support for older browsers -->
<script src="/bower_components/webcomponentsjs/webcomponents.min.js"></script>

<!-- Import element -->
<link rel="import" href="/bower_components/google-chart/google-chart.html">
Line chart
Creating a line chart:
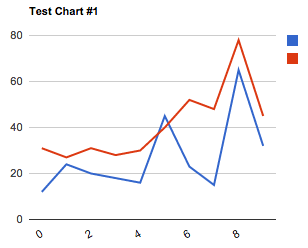
$chart = new LineChart(['title' => 'Test Chart #1']);
$chart->addData(new SequenceData([12, 24, 20, 18, 16, 45, 23, 15, 65, 32], ['label' => 'Line #1']));
$chart->addData(new SequenceData([31, 27, 31, 28, 30, 40, 52, 48, 78, 45], ['label' => 'Line #2']));
Get element HTML with $chart->getElement().
<google-chart style=""
    type='line'
    options='{"title":"Test Chart #1"}'
    cols='[{"type":"string"},{"type":"number","label":"Line #1"},{"type":"number","label":"Line #2"}]'
    rows='[["0",12,31],["1",24,27],["2",20,31],["3",18,28],["4",16,30],["5",45,40],["6",23,52],["7",15,48],["8",65,78],["9",32,45]]'>
</google-chart>
See all possible options for line charts.
The above code would result into this chart.
Pie chart
Creating pie chart:
$chart = new PieChart(['width' => '150px', 'height' => '150px', 'pieHole' => 0.5]);
$chart->addData([new SingleData(40, 'Arc #1'), new SingleData(60, 'Arc #2'), new SingleData(80, 'Arc #3')]);
Get element HTML with $chart->getElement().
<google-chart style="width:150px;height:150px;"
    type='pie'
    options='{"pieHole":0.5}'
    cols='[{"type":"string","label":"Title"},{"type":"number","label":"Value"}]'
    rows='[["Arc #1",40],["Arc #2",60],["Arc #3",80]]'>
</google-chart>
See all possible options for pie charts.
Bar chart
Creating bar chart:
$chart = new BarChart();
$chart->addData(new SequenceData([20, 40, 30]));
Get element HTML with $chart->getElement().
<google-chart style=""
    type='bar'
    options='[]'
    cols='[{"type":"string"},{"type":"number"}]'
    rows='[["0",20],["1",40],["2",30]]'>
</google-chart>
See all possible options for bar charts.
Column chart
Creating column chart:
$chart = new ColumnChart(['width' => '700px', 'isStacked' => true, 'legend' => ['position' => 'none']]);
$chart->addData(new SequenceData(["a1" => 20, "a2" => 40, "a3" => 30], ['label' => 'aaa']));
$chart->addData(new SequenceData(["a1" => 15, "a2" => 32, "a3" => 34], ['label' => 'bbb']));
$chart->addData(new SequenceData(["a1" => 21, "a2" => 42, "a3" => 17], ['label' => 'ccc']));
Get element HTML with $chart->getElement().
<google-chart style="width:700px;"
    type='bar'
    options='{"isStacked":true,"legend":{"position":"none"}}'
    cols='[{"type":"string"},{"type":"number","label":"aaa"},{"type":"number","label":"bbb"},{"type":"number","label":"ccc"}]'
    rows='[["a1",20,15,21],["a2",40,32,42],["a3",30,34,17]]'>
</google-chart>
See all possible options for column charts.
Tests
All tests in this project are based on behat.
$ bin/behat
Then manually check generated charts in features/generated_html
License
Google Chart Generator is licensed under The MIT License.
martinsik/google-chart-generator 适用场景与选型建议
martinsik/google-chart-generator 是一款 基于 PHP 开发的 Composer 扩展包,目前已累计 39 次下载、GitHub Stars 达 23, 最近一次更新时间为 2015 年 07 月 26 日, 在 PHP 生态内属于活跃度较高的组件。
我们在过去多个企业项目中使用过 martinsik/google-chart-generator 或与其功能相近的方案,如果你在选型或落地过程中遇到问题,例如 版本兼容、二次改造、私有化封装、与内部系统对接、生产 BUG 排查,欢迎联系我们协助评估。
基于 martinsik/google-chart-generator 在你已有业务上做功能扩展、字段裁剪、UI 适配、与内部账号 / 权限 / 日志系统的深度对接。
线上偶发问题、内存泄漏、慢查询、并发异常等排查修复;针对高流量场景做缓存、队列、索引层面的调优。
承接完整的项目从需求 → 设计 → 开发 → 上线 → 长期运维;也可按月提供技术保姆服务。
统计信息
- 总下载量: 39
- 月度下载量: 0
- 日度下载量: 0
- 收藏数: 23
- 点击次数: 23
- 依赖项目数: 0
- 推荐数: 0
其他信息
- 授权协议: MIT
- 更新时间: 2015-07-26