mohsenabrishami/stethoscope
Composer 安装命令:
composer require mohsenabrishami/stethoscope
包简介
laravel server monitoring
README 文档
README
 Stethoscope
For listening to your Laravel app server heartbeat

Features | Installation | Usage | Dashboard | Configuration | Notification | Testing | Changelog | Contributing | Credits | License

This Laravel package allows you to monitor the infrastructure.
With this package, You can check your server health at any time.
Features
-
Monitoring CPU usage percentage
-
Monitoring memory usage percentage
-
Monitoring Storage free space
-
Checking the network connection status
-
Checking web Server status (Nginx/Apache)
-
Recording log when CPU, memory, and Storage usage exceeds the specified threshold
-
Recording log when the network connection fails or the web server deactivated
-
Sending email when a problem occurs in the CPU, memory, Storage, web server, and network of server
Do you need more options? you can make an issue or contributes to the package
Get Started
Requirements
- PHP 8.0+
- Laravel 8+
- Linux Operating System (Debian, Ubuntu, mint, ...)
Installation
This package requires PHP 8.0 and Laravel 8.0 or higher. You can install the package via composer:
composer require mohsenabrishami/stethoscope
and then run:
php artisan vendor:publish --tag=stethoscope-publish-config
Stethoscope allows you to record reports both in a file and in a database. If you set the database driver in the config file, you must run migrate command:
php artisan migrate
Usage
Once installed, see your server health details with a command:
php artisan stethoscope:listen
The output will be like this:

But the work of this package didn't stop there. you can set thresholds for CPU, memory and Storage consumption. if CPU and memory consumption exceeds thresholds or Storage free space is less than thresholds, then a log is created from details consumption. also, you can config this package so that if the deactivated web server or disconnected internet log is created. To start monitoring your server, just run this command:
php artisan stethoscope:monitor
You can monitor your server constantly with the run this command by a cron job. You may want to be notified if there is a problem in the server. For this, it is enough to set your email admin in the config file.
If you are worried about the increase in logs, use the following command. This command deletes old logs based on the number of days you defined in the config file.
php artisan stethoscope:clean
Dashboard
Stethoscope provides a dashboard where you can easily see the current status of the server at any time. Also, in this dashboard, you can see a history of the times when resource consumption exceeded the limit or when the network and web server were disabled.
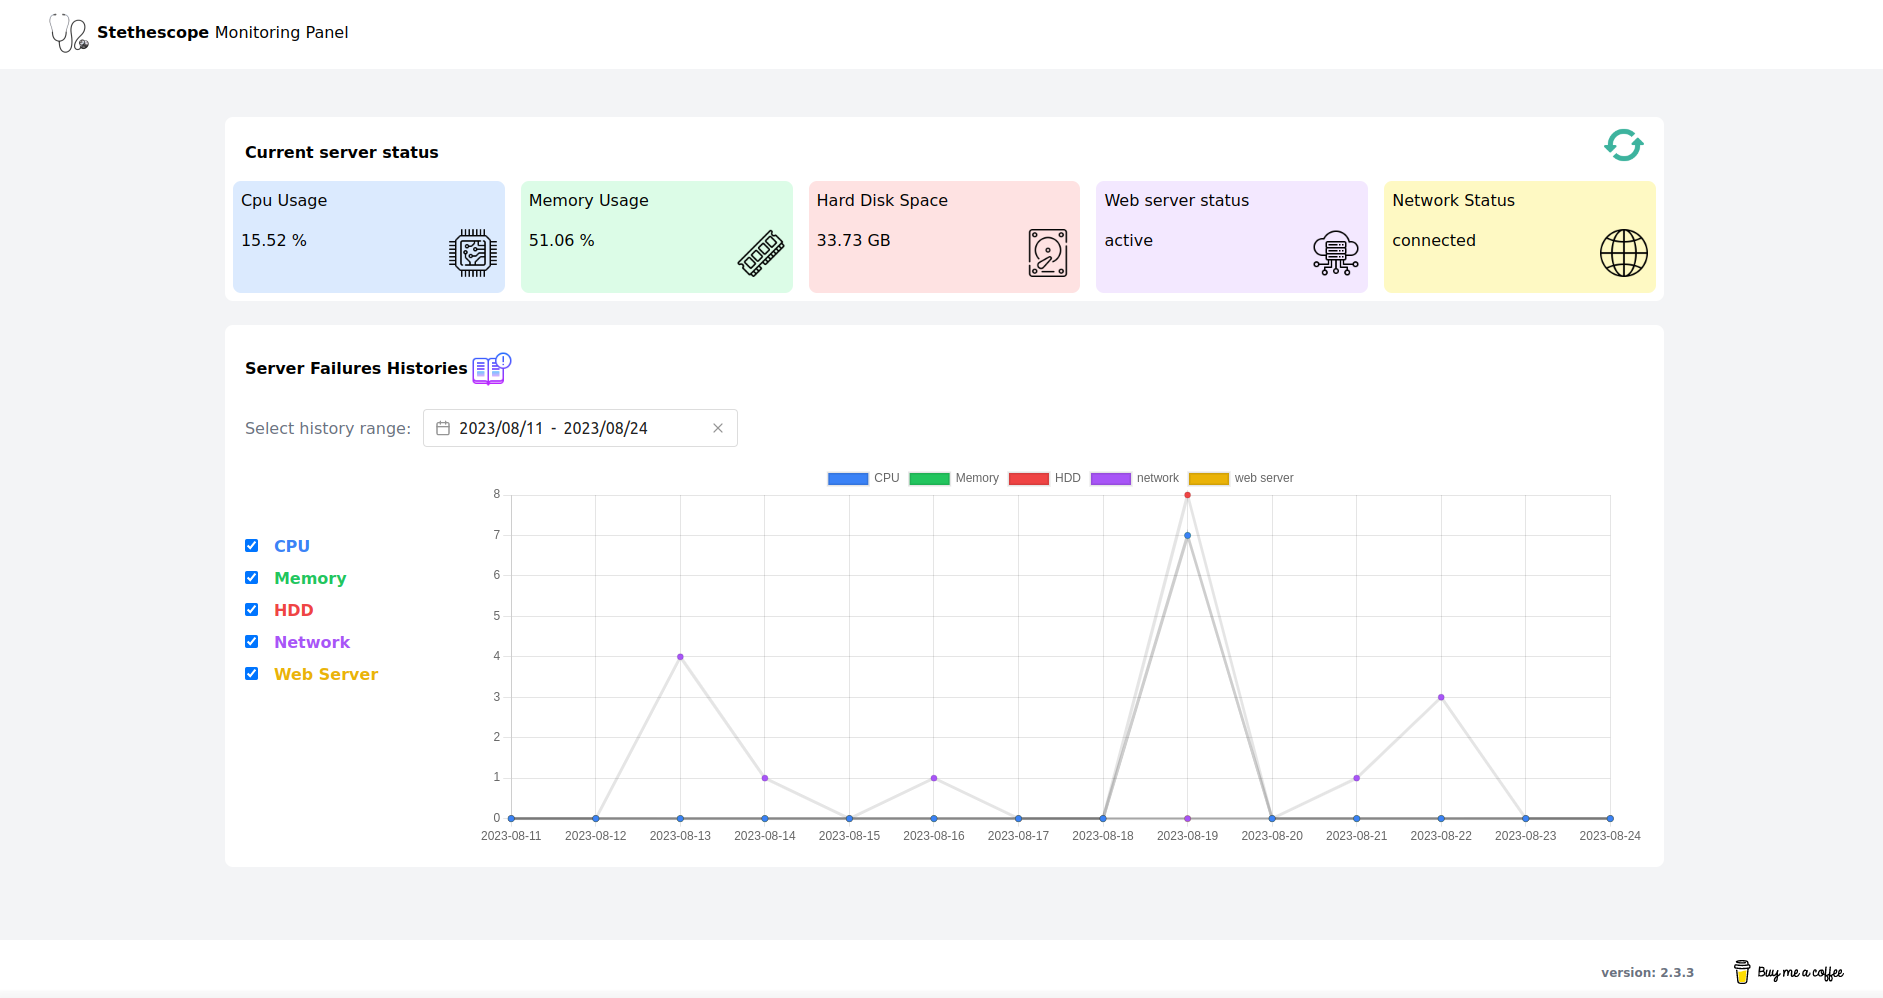
If you use the monitoring panel, you must publish the build files:
php artisan vendor:publish --tag=stethoscope-publish-view
Remember that the monitoring dashboard is disabled by default. To activate, you must set monitoring_panel.status to true in config file. Also, the log storage driver must be a database, not a file.
You can put a key to access the admin panel. If you define a key, you can access the dashboard only when you enter the key in the address.
you can access this panel with address https://yoursite/monitoring-panel?key=sampletoken
    /*
    |--------------------------------------------------------------------------
    | Dashboard Configuration
    |--------------------------------------------------------------------------
    | Here, you can specify whether the monitoring panel is enabled and the key required to access it.
    | Also, you can customize the monitoring panel path.
    |
    */
    'monitoring_panel' => [
        'status' => false,
        'path' => 'monitoring-panel',
        'key' => env('MONITORING_PANEL_KEY'),
    ],
Configuration
You can easily customize this package in the config/stethoscope.php.
In this file, You can configure the following:
-
Resources that should be monitored. We can monitor the CPU, memory, Storage, network connection, and web server status.
-
Web server that is installed on your server. We support Nginx and apache.
-
Storage driver and path to saving log files.
-
Resources Thresholds. Include maximum CPU and memory usage and minimum Storage space.
-
Custom network URL for network connection monitor.
-
Driver to save resource logs (support file storage and database).
-
Emails address to send notification emails when your server has problems.
-
Number of days for which resource logs must be kept.
By default, the configuration looks like this:
    /*
    |--------------------------------------------------------------------------
    | Monitorable Resources
    |--------------------------------------------------------------------------
    | Here you can Define which resources should be monitored.
    | Set true if you want a resource to be monitored, otherwise false.
    |
    */

    'monitorable_resources' => [
        'cpu' => true,
        'memory' => true,
        'storage' => true,
        'network' => true,
        'web_server' => true,
    ],

    /*
    |--------------------------------------------------------------------------
    | Web Server Name
    |--------------------------------------------------------------------------
    | Here you can define what web server installed on your server.
    | Set `nginx` or `apache`
    |
    */

    'web_server_name' => 'nginx',

    /*
    |--------------------------------------------------------------------------
    | Log File Storage
    |--------------------------------------------------------------------------
    | Define storage driver and path for save log file.
    |
    */

    'log_file_storage' => [
        'driver' => 'local',
        'path' => 'stethoscope/',
    ],

    /*
    |--------------------------------------------------------------------------
    | Thresholds
    |--------------------------------------------------------------------------
    | If resource consumption exceeds these thresholds, a log will be created.
    | You may define maximum CPU and memory usage by percent.
    | You may define minimum Storage space by GB.
    |
    */

    'thresholds' => [

        'cpu' => env('CPU_MONITOR_THRESHOLD', 90),

        'memory' => env('MEMORY_MONITOR_THRESHOLD', 80),

        'storage' => env('storage_MONITOR_THRESHOLD', 10),

    ],

    /*
    |--------------------------------------------------------------------------
    | Network Monitor URL
    |--------------------------------------------------------------------------
    | Here you can define the multiple desired URL for network monitoring.
    | If an address cannot be reached, it checks other addresses to make sure that the problem is with the server network
    |
    */

    'network_monitor_url' => env('NETWORK_MONITOR_URL', ['https://1.1.1.1', 'https://www.google.com']),

    /*
    |--------------------------------------------------------------------------
    | Log Record Driver
    |--------------------------------------------------------------------------
    | Set `database` for save logs in database and `file` for record logs in file
    |
    */

    'drivers' => [
        'log_record' => env('STETHOSCOPE_LOG_DRIVER', 'file'),
    ],

    /*
    |--------------------------------------------------------------------------
    | Clean up resource logs
    |--------------------------------------------------------------------------
    | Here you define the number of days for which resource logs must be kept.
    | Older resource logs will be removed.
    |
    */
    'cleanup_resource_logs' => 7,
Notification
stethoscope can send you server problems through notifications. By default, sending notifications via email is supported. To use this feature, you must enter the email address of the admin user in the config file.
'mail' => [
    'to' => null,
],
Adding extra notification channels
It's easy to add an extra notification channel such as Telegram or native mobile push notification, etc. In the following example we're going to add the Telegram push notifications channel. Other notification drivers can be added in the same way.
1. Install the notification channel driver
First you need to create your custom driver. For Telegram push notifications, you can use following package:
laravel-notification-channels/telegram
After composer has pulled in the package, just follow the installation instructions of the package to complete the installation.
2. Creating your own custom notification
In the following, you'll need to create your own notification class like the one below:
namespace App\Notifications;

use Illuminate\Bus\Queueable;
use MohsenAbrishami\Stethoscope\Notifications\LogReportNotification;
use NotificationChannels\Telegram\TelegramMessage;

class StethoscopeNotification extends LogReportNotification
{
    use Queueable;

    public function toTelegram()
    {
        $formattedMessage = "
        *Message from stethoscope:*

        *Be careful!! 💀*

        Your server has the following problems:
        " . (isset($this->logs['cpu']) ? '- Cpu usage: ' . $this->logs['cpu'] . ' %' : '') . "
        " . (isset($this->logs['memory']) ? '- Memory usage: ' . $this->logs['memory'] . ' %' : '') . "
        " . (isset($this->logs['network']) ? '- Network connection status: ' . $this->logs['network'] : '') . "
        " . (isset($this->logs['storage']) ? '- Remaining free space on the Storage:  ' . $this->logs['storage'] . ' GB' : '') . "
        " . (isset($this->logs['webServer']) ? '- Web server status:  ' . $this->logs['webServer'] : '') . "
    ";

        return TelegramMessage::create()->content($formattedMessage);
    }
}
3. Creating your own custom notifiable
Also, you should create notifiable class. For this example, as you can see below, the Telegram channel ID should be returned:
namespace App\Notifications;

use MohsenAbrishami\Stethoscope\Notifications\Notifiable;

class StethoscopeNotifiable extends Notifiable
{
    public function routeNotificationForTelegram()
    {
        return config('stethoscope.notifications.telegram.channel_id');
    }
}
4. Register your custom notification in the config file
Finally, you should register notification and notifiable classes and add the telegram channel id:
    /*
    |--------------------------------------------------------------------------
    | Notifications
    |--------------------------------------------------------------------------
    | You can get notified when specific events occur. you should set an email to get notifications here.
    | If you don't need to send an email notification, set null.
    |
    */
    'notifications' => [

        'notifications' => [
            App\Notifications\StethoscopeNotification::class => ['telegram'],
        ],

        'notifiable' => App\Notifications\StethoscopeNotifiable::class,

        'telegram' => [
            'channel_id' => env('TELEGRAM_CHAT_ID')
        ]

    ],
Testing
Run the tests with:
composer test
Changelog
Please see CHANGELOG for more information on what has changed recently.
Contributing
Please see CONTRIBUTING for details.
Credits
License
The MIT License (MIT). Please see License File for more information.
mohsenabrishami/stethoscope 适用场景与选型建议
mohsenabrishami/stethoscope 是一款 基于 Vue 开发的 Composer 扩展包,目前已累计 25k 次下载、GitHub Stars 达 290, 最近一次更新时间为 2022 年 09 月 17 日, 在 PHP 生态内属于活跃度较高的组件。
它主要适用于以下技术方向: 「laravel」 「server monitoring」 「stethoscope」 等业务场景。在实际项目中,围绕这些方向常见需要落地的问题包括:接口对接、性能调优、并发安全、与既有框架(Laravel / ThinkPHP / Yii / Webman 等)的兼容适配,以及生产环境的日志埋点与稳定性保障。
我们在过去多个企业项目中使用过 mohsenabrishami/stethoscope 或与其功能相近的方案,如果你在选型或落地过程中遇到问题,例如 版本兼容、二次改造、私有化封装、与内部系统对接、生产 BUG 排查,欢迎联系我们协助评估。
基于 mohsenabrishami/stethoscope 在你已有业务上做功能扩展、字段裁剪、UI 适配、与内部账号 / 权限 / 日志系统的深度对接。
线上偶发问题、内存泄漏、慢查询、并发异常等排查修复;针对高流量场景做缓存、队列、索引层面的调优。
承接完整的项目从需求 → 设计 → 开发 → 上线 → 长期运维;也可按月提供技术保姆服务。
与 mohsenabrishami/stethoscope 相关的其它包
同方向 / 同关键字的高下载量 PHP Composer 包推荐,方便对比选型:
A Symfony bundle for chameleon-system/sanitycheck
A lightweight and powerful OAuth 2.0 authorization and resource server library with support for all the core specification grants. This library will allow you to secure your API with OAuth and allow your applications users to approve apps that want to access their data from your API.
SoftWax Health Check Bundle for Symfony framework
1Pilot client for Symfony
Statsd (Object Oriented) client library for PHP
APM agent for laravel projects to monitor the application with elastic apm tools.
统计信息
- 总下载量: 25k
- 月度下载量: 0
- 日度下载量: 0
- 收藏数: 291
- 点击次数: 15
- 依赖项目数: 0
- 推荐数: 0
其他信息
- 授权协议: MIT
- 更新时间: 2022-09-17