tacnoman/dephpugger
Composer 安装命令:
composer require tacnoman/dephpugger
包简介
Debug for php in terminal.
README 文档
README

What is Dephpugger?
Dephpugger (read depugger) is an open source library that allows a developer to debug in php direct in terminal, without necessary configure an IDE. The dephpugger run in Php Built in Server using another command. You can use for:
Web applications
Lumen in example
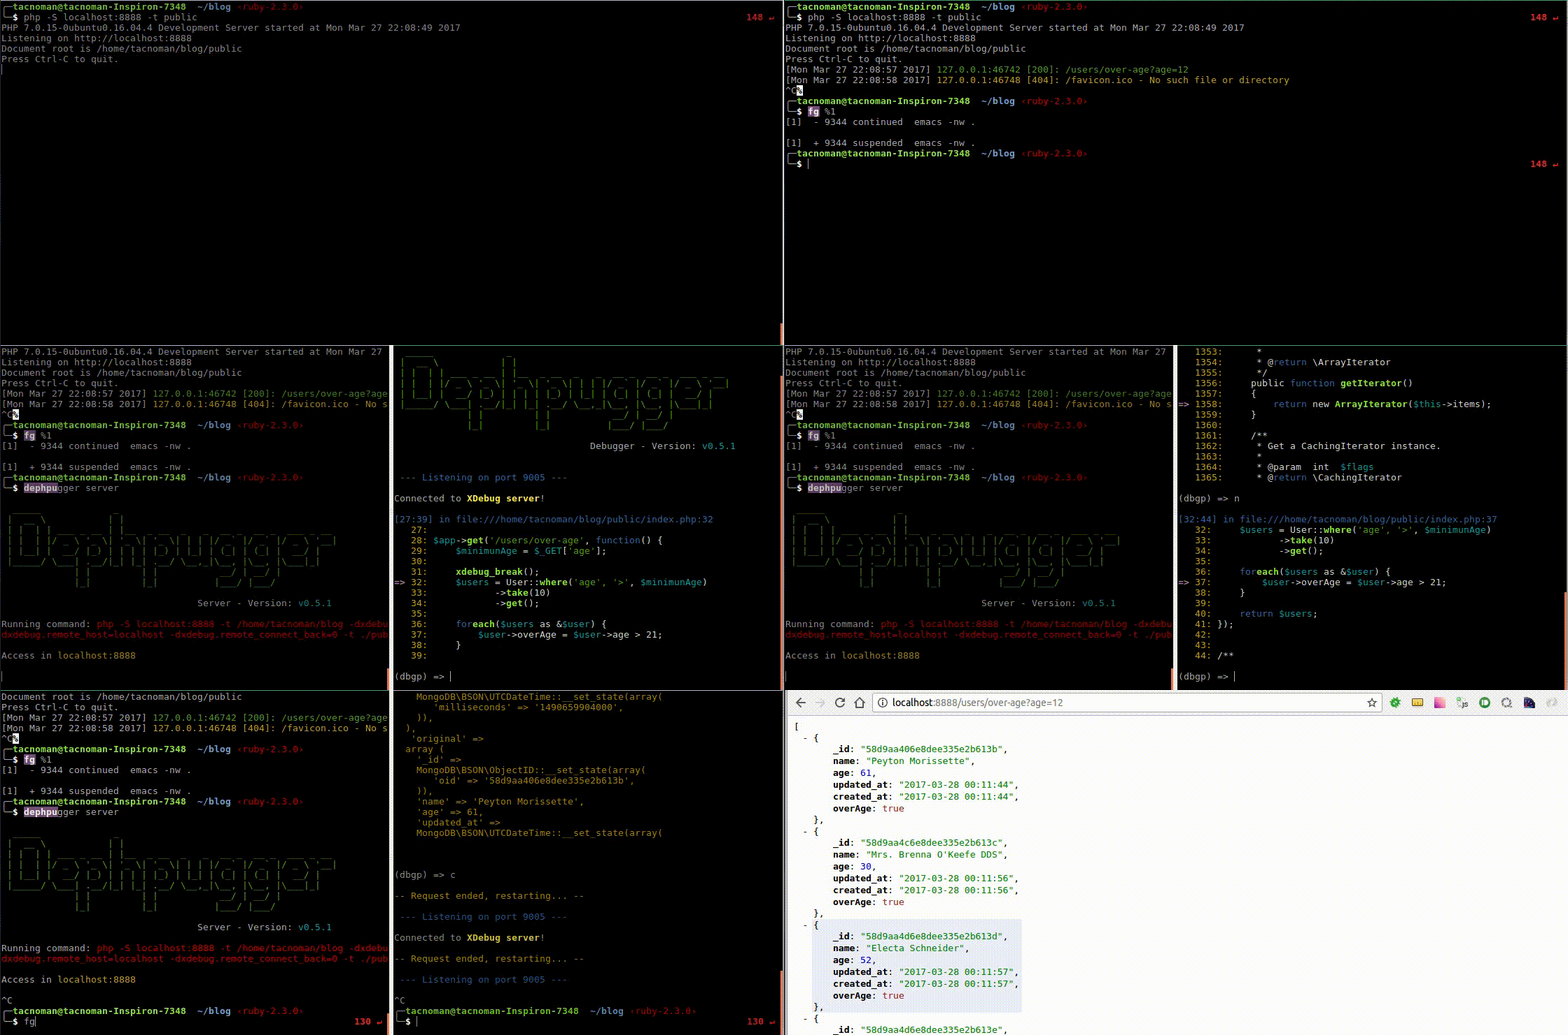
Image 1.0 - Screenrecord for debug web
Cli Scripts
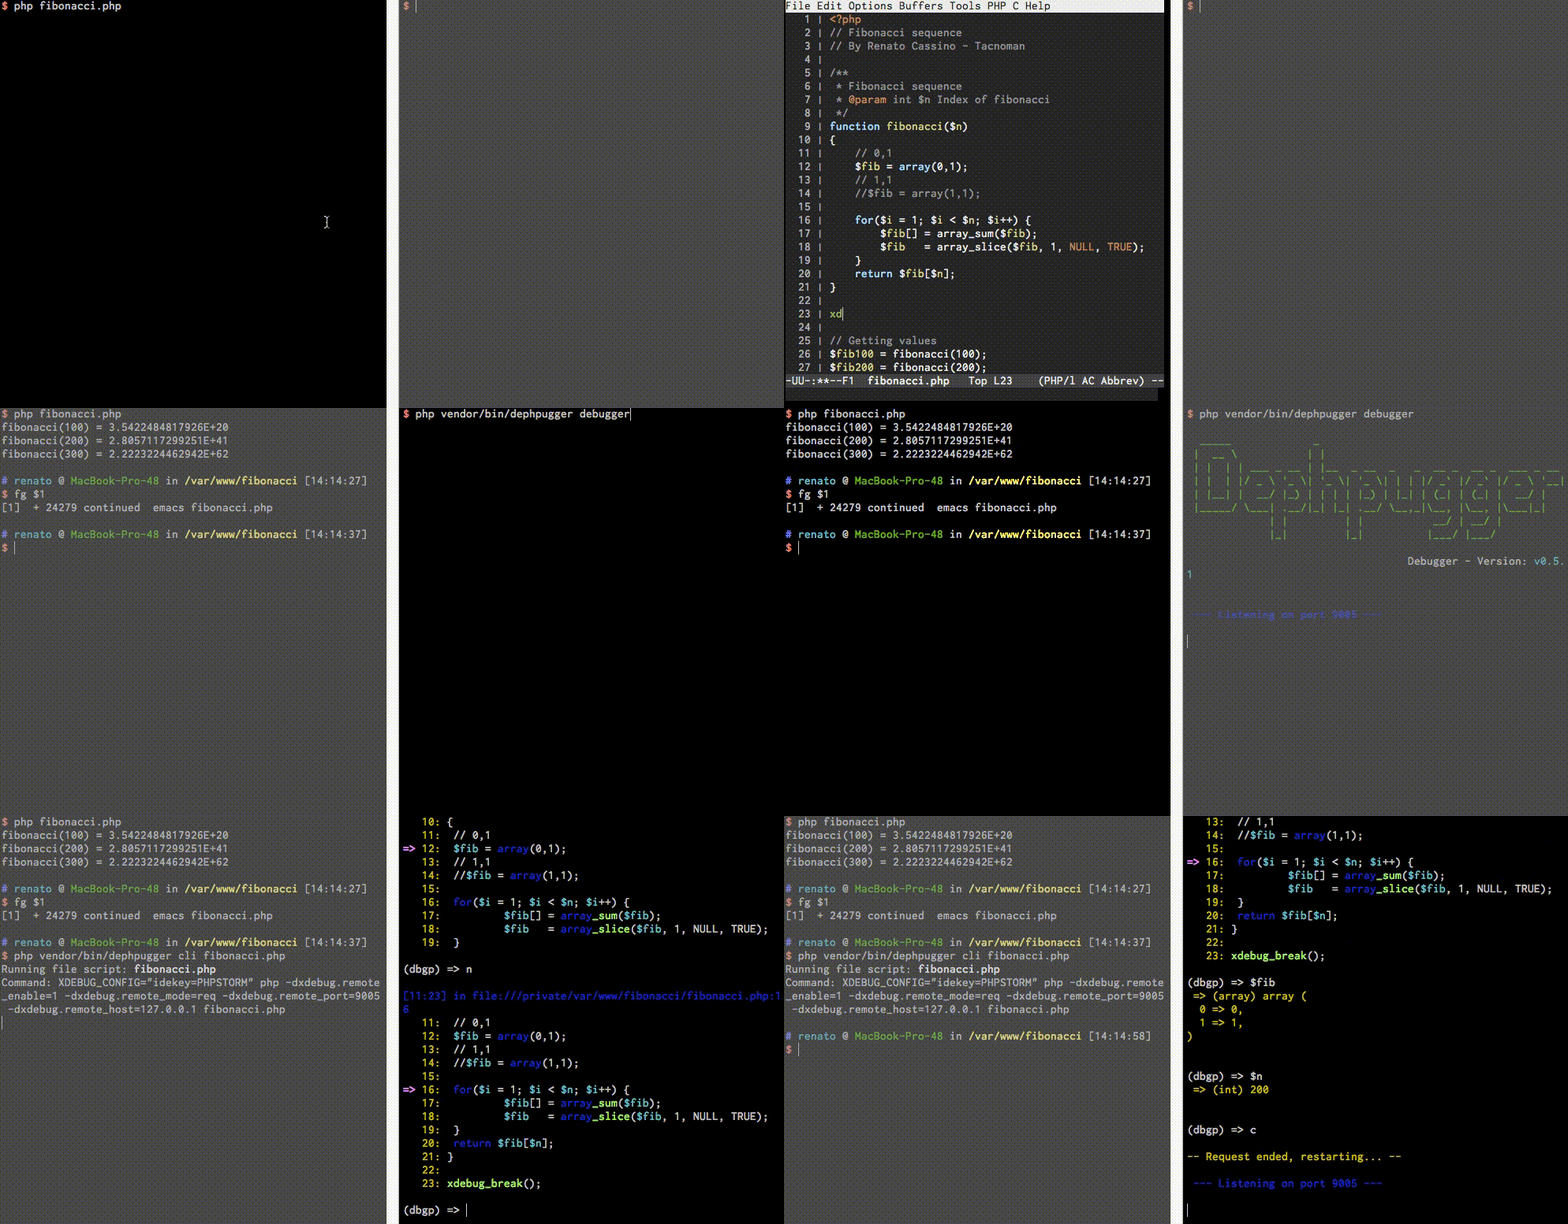
Image 1.1 - Screenrecord for debug cli scripts
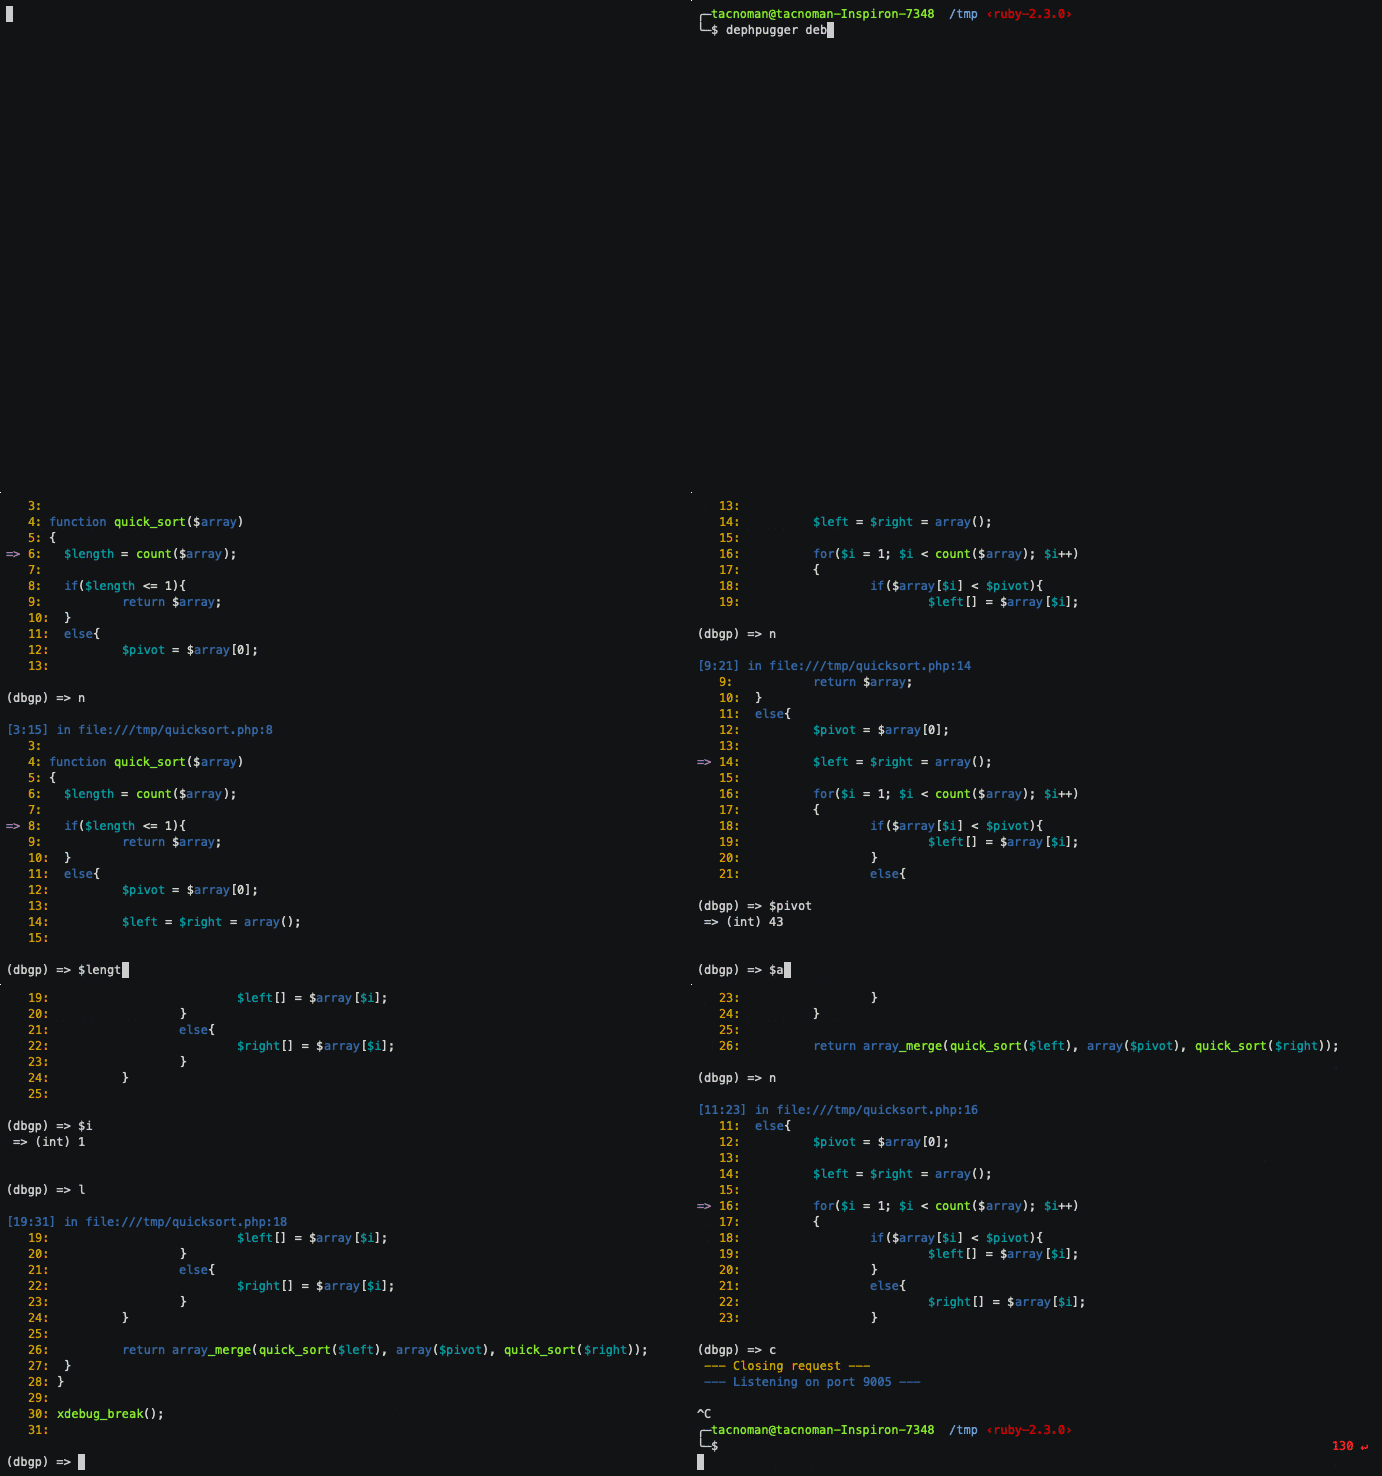
Another example
Install
To install you must run this code (using the composer).
$ composer require tacnoman/dephpugger
Install globally
In Linux or Mac Os X
Run this command:
$ composer global require tacnoman/dephpugger
And add in your ~/.bash_profile.
export PATH=$PATH:$HOME/.composer/vendor/bin
Now, run source ~/.bash_profile and you can run the commands using only $ dephpugger.
Is possible to use the composer command to run the dephpugger. You can use:
$ composer exec dephpugger <command>
This last command will run in local or global installation.
In Windows
Sorry for this :/ I don't have Windos SO to run the Dephpugger, but I'm waiting your Pull Request to solve this ;D
But you can use Docker
Using phar file
$ wget https://raw.githubusercontent.com/renatocassino/dephpugger/master/dephpugger.phar -O dephpugger
$ chmod +x ./dephpugger
$ mv ./dephpugger /usr/local/bin/dephpugger
Or installing via curl
$ curl https://raw.githubusercontent.com/renatocassino/dephpugger/master/installer.sh | bash
Install XDebug
To install XDebug in Linux you must run:
$ sudo apt-get install php-7.2-cli php-dev php-pear
$ sudo pecl install xdebug
Find the last line, similar to: You should add "zend_extension=/usr/lib/php/20170718/xdebug.so" to php.ini and
copy to your php.ini file. To get the php.ini file, you can run:
$ php --info | grep php.ini

Configuration File (php.ini) Path => /etc/php/7.2/cli
Loaded Configuration File => /etc/php/7.2/cli/php.ini
Copy the zend_extension=/usr/lib/php/20170718/xdebug.so to last line in /etc/php/7.2/cli/php.ini.
Docker
$ docker run --rm -p 8888:8888 tacnoman/dephpugger:latest server
Dependencies
- PHP 7.0 or more (not tested in older versions)
- Xdebug activate
- A Plugin for your browser (If you want to debug a web application)
Plugins for
You can run this commands to check your dependencies:
$ vendor/bin/dephpugger requirements
$ vendor/bin/dephpugger info # To get all values setted in xDebug

# Or in global

$ dephpugger requirements
$ dephpugger info
Usage
To usage you must (after installation) run two binaries in vendor/bin folder.
$ php vendor/bin/dephpugger debugger # Debugger waiting debug
$ php vendor/bin/dephpugger server   # Server running in port 8888

# Or in global

$ dephpugger debugger
$ dephpugger server
You must run in two different tabs (in next version you'll can run in an uniq tab). After run theese commands, you need to put the follow line in your code:
<?php
# ...
xdebug_break(); # This code is a breakpoint like ipdb in Python and Byebug in Ruby
# ....
Now, you can open in your browser the page (localhost:8888/[yourPage.php]). When you request this page your terminal will start in breakpoint (like the image 1.0).
To debugger a php script, you could run:
$ php vendor/bin/dephpugger cli myJob.php

# Or in global

$ dephpugger cli myJob.php
Comands after run
When you stop in a breakpoint you can make theese commands:
| Command | Alias | Explanation |
|---|---|---|
| next | n | To run a step over in code |
| step | s | To run a step into in code |
| set <cmd>:<value> | Change verboseMode or lineOffset in runtime | |
| continue | c | To continue script until found another breakpoint or finish the code |
| list | l | Show next lines in script |
| list-previous | lp | Show previous lines in script |
| help | h | Show help instructions |
| $variable | Get a value from a variable | |
| $variable = 33 | Set a variable | |
| my_function() | Call a function | |
| dbgp(<command>) | To run a command in dbgp | |
| quit | q | Exit the debugger |
Configuration (is simple)
The Dephpugger project has default options like a port, host, socket port, etc. You can change this values adding a file .dephpugger.yml in root directory project.
You can create in your .dephpugger.yml file the configurations. Like this:
---
debugger:
  host: mysocket.dev # default: 0.0.0.0
  port: 9002 # default: 9005
  lineOffset: 10 # default: 6
  verboseMode: false # default: false
  historyFile: ~/.dephpugger_history # default: .dephpugger_history
server:
  host: myproject.dev # default: 0.0.0.0
  port: 8080 # default: 8888
  path: ./public/ # default: null
  file: index.php # default: null
These values will replace the default configuration.
Full documentation
To see the full documentation click here.
How to use with phpunit, behat, codeception and others
The documentation to use, click here.
Run tests
$ composer test
$ composer lint
Bugs?
Send me an email or open an issue:
Renato Cassino - Tacnoman - <renatocassino@gmail.com>
Articles and Videos
tacnoman/dephpugger 适用场景与选型建议
tacnoman/dephpugger 是一款 基于 PHP 开发的 Composer 扩展包,目前已累计 12.55k 次下载、GitHub Stars 达 204, 最近一次更新时间为 2017 年 02 月 26 日, 在 PHP 生态内属于活跃度较高的组件。
我们在过去多个企业项目中使用过 tacnoman/dephpugger 或与其功能相近的方案,如果你在选型或落地过程中遇到问题,例如 版本兼容、二次改造、私有化封装、与内部系统对接、生产 BUG 排查,欢迎联系我们协助评估。
基于 tacnoman/dephpugger 在你已有业务上做功能扩展、字段裁剪、UI 适配、与内部账号 / 权限 / 日志系统的深度对接。
线上偶发问题、内存泄漏、慢查询、并发异常等排查修复;针对高流量场景做缓存、队列、索引层面的调优。
承接完整的项目从需求 → 设计 → 开发 → 上线 → 长期运维;也可按月提供技术保姆服务。
统计信息
- 总下载量: 12.55k
- 月度下载量: 0
- 日度下载量: 0
- 收藏数: 204
- 点击次数: 24
- 依赖项目数: 1
- 推荐数: 0
其他信息
- 授权协议: MIT
- 更新时间: 2017-02-26